
Rappahannock County – Fauquier County –Madison County – Culpeper County
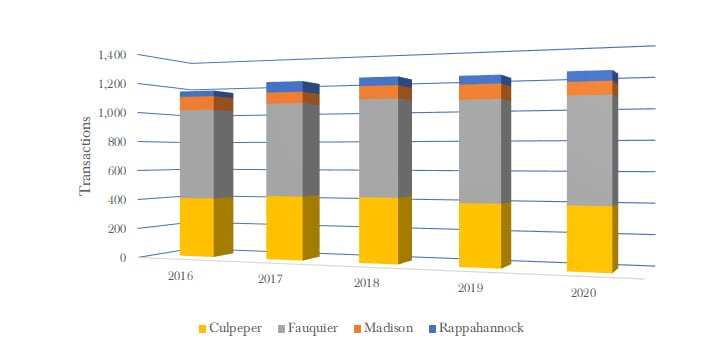 Through June 2020, the number of real estate transactions in the Heart of the Piedmont increased 1%
compared to the prior year with 1,213 properties selling in 2020 while 1,205 properties sold in the same time period in 2019. The total dollar value of real estate sales increased by 9% with $515 million sold in 2020 and
$474 million sold in 2019.
Residential transactions increased in numbers by 1%. On a county by county basis, Fauquier and
Rappahannock were up 3% and 2% respectively while Culpeper and Madison declined by 1% and 10%.
Land & Farm transactions decreased by 3%. On a county by county basis, Rappahannock was up 67% while
Culpeper, Fauquier and Madison decreased by 2%, 7% and 20% respectively.
Rappahannock Home Sales
KEY RESIDENTIAL MARKET INDICATORS
| NUMBER OF TRANSACTIONS | There were 44 transactions in 2020 compared to 43 in 2019, an increase of 2%. | |
| AVERAGE HOME SALES PRICE | The average home sales price increased 19% to $435,191 from $367,036. | |
| AVERAGE DAYS ON MARKET | Average days on market for properties sold was 135 compared to 148, a decrease of 9%. | |
| ACTIVE RESIDENTIAL LISTINGS | There was a monthly average of 82 homes on the market in the first two quarters of 2020 compared to 93 for the same time period in 2019, a decrease of 12%. | |
| SALES PRICE TO LIST PRICE | On average, homes sold for 95.8% of the list price, relatively flat with the prior year. |
Twenty-seven properties sold in the second quarter of 2020 as compared to 24 properties in the second quarter
of 2019. With such small numbers it is difficult to draw meaningful trends.
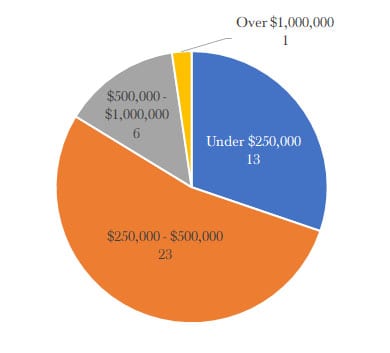
There are currently 62 residential properties for sale which is about an 9 month supply. (Of those 62
properties, 24 are under contract suggesting that the 3rd quarter will be quite strong.) The homes currently on
the market have an average days on market of 94. The average list price of residential listings is $969,901.
| 2019 Q2 RESIDENTIAL TRANSACTIONS | 2020 Q2 RESIDENTIAL TRANSACTIONS |
 |
 |
Rappahannock Land & Farm Sales
KEY LAND AND FARM MARKET INDICATORS
| NUMBER OF TRANSACTIONS | There were 20 transactions in the first two quarters of 2020 compared to 12 in the same time period of 2019, an increase of 67%. | |
| AVERAGE PRICE PER ACRE | The price per acre for raw land over 25 acres increased 5% from $6,244 to $6,557. | |
| AVERAGE DAYS ON MARKET | Average days on market for properties sold was 196 compared to 268, a decrease of 27%. | |
| ACTIVE LAND & FARM LISTINGS | There was an average of 66 properties on the market in the first two quarters compared to 74 in the first two quarters of 2019. | |
| SALES PRICE TO LIST PRICE | Land and farms sold for 93.8% of the list price as compared to 94.9% in 2019, a decrease of 1%. |
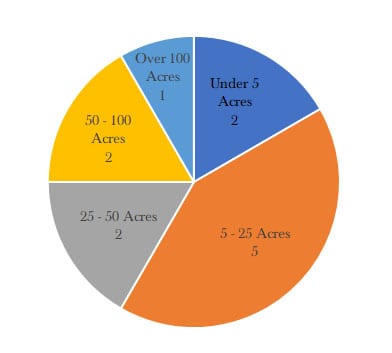
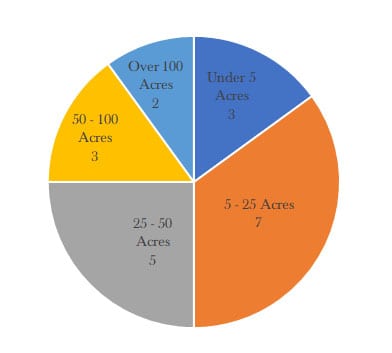
There were nine land and farm transactions in the second quarter of 2020 compared to eight in the second
quarter of 2019.
There are currently 73 land and farm lots for sale, which is about a 23 month supply. The average days on
market for the current lots on the market is 279 days.
| Q2 2019 LAND & FARM TRANSACTIONS BY ACREAGE | Q2 2020 LAND & FARM TRANSACTIONS BY ACREAGE |
 |
 |
View the 2019 Market Trends Report.
View the 2018 Market Trends Report.
View the 2017 Market Trends Report.
Review other Market Trends Reports: Rappahannock County– Fauquier County – Madison County – Culpeper County